
(Tables may need to be scrolled to view full data on mobile devices) March 19th, 2026 kicked off a widespread heat event that developed across most of the United States, bringing temperatures well above seasonal norms and, in some cases, into record-breaking territory. By the weekend, the pattern had intensified - pushing anomalies to extremes rarely seen this early in the year - before another passing system brought a sharp return to more seasonal cooler conditions. Let's take a closer look at how the event unfolded, using observations from the Tempest Network to highlight both the scale and intensity of the heat.
QUICK LINKS
- What is a Heat Dome?
- Thursday, March 19th Graphics & Data
- Saturday & Sunday Graphics & Data
What Is a Heat Dome?
In its simplest terms, a heat dome forms when a strong system of high pressure settles over a region and effectively “traps” warm air beneath it. As the air sinks, it compresses and warms, leading to rising temperatures at the surface. Add in limited cloud cover and persistent sunshine, and you’ve got heat that builds day after day, often resulting in multi-day stretches of above-normal temperatures. In this case, that pattern began to take shape midweek, setting the stage for the conditions that followed.
Early Signals: Thursday, March 19
By Thursday (3/19/2026), temperatures across much of the U.S. were already trending well above average, offering an early indication of the developing pattern.

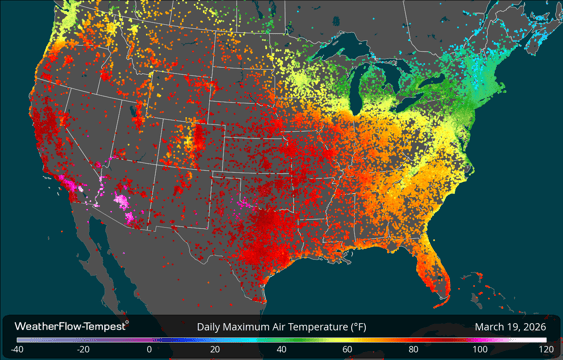

In many areas, temperatures were running approximately 25–30°F above normal, with the strongest anomalies beginning to emerge across the western and central U.S.
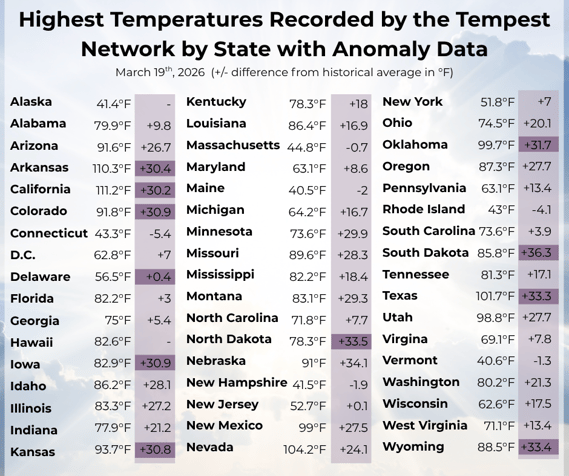
Top 20 Recorded Temperatures by Any U.S. Tempest Station - 3/19/2026
(Tables may need to be scrolled to view full data on mobile devices)
|
State |
Closest City |
Temperature |
Anomaly |
|
CA |
Indio |
111.2 |
30.2 |
|
CA |
Indio |
110.8 |
29.8 |
|
CA |
Indio |
110.7 |
29.7 |
|
AZ |
Goodyear |
110.3 |
30.4 |
|
AZ |
Avondale |
109.9 |
30.2 |
|
AZ |
Buckeye |
109.9 |
31.1 |
|
CA |
La Quinta |
109.8 |
29.9 |
|
AZ |
Hidden Shores Village |
109.8 |
28.1 |
|
CA |
La Quinta |
109.6 |
28.6 |
|
AZ |
Phoenix |
109.6 |
31.4 |
|
AZ |
El Mirage |
109.6 |
30.4 |
|
CA |
Rancho Mirage |
109.4 |
29.1 |
|
CA |
Palm Desert |
109.4 |
28.9 |
|
AZ |
Goodyear |
109.4 |
29.7 |
|
AZ |
Yuma |
109.4 |
27.8 |
|
AZ |
Litchfield Park |
109.4 |
30.2 |
|
CA |
Indian Wells |
109.2 |
29 |
|
CA |
La Quinta |
109.2 |
28.5 |
|
AZ |
Phoenix |
109.2 |
31.4 |
|
AZ |
Phoenix |
109.2 |
29.4 |
Top TEmperature REcorded in Each State - 3/19/2026
*Note: For this data, the historical “average” temperature is coming from PRISM Group (PRISM Group, Oregon State University, https://prism.oregonstate.edu, accessed 3/23/2026). Data for Hawaii and Alaska not available.
(Tables may need to be scrolled to view full data on mobile devices)
|
State |
Closest City |
Temperature |
Anomaly |
|
CA |
Indio |
111.2 |
30.2 |
|
AZ |
Goodyear |
110.3 |
30.4 |
|
NV |
Bullhead City |
104.2 |
24.1 |
|
TX |
Childress County |
101.7 |
33.3 |
|
OK |
Eldorado |
99.7 |
31.7 |
|
NM |
Dexter |
99 |
27.5 |
|
UT |
St. George |
98.8 |
27.7 |
|
KS |
Ashland |
93.7 |
30.8 |
|
CO |
Prowers County |
91.8 |
30.9 |
|
AR |
Fort Smith |
91.6 |
26.7 |
|
NE |
Arapahoe |
91 |
34.1 |
|
MO |
Anderson |
89.6 |
28.3 |
|
WY |
Goshen County |
88.5 |
33.4 |
|
OR |
Kerby |
87.3 |
27.7 |
|
LA |
Bossier Parish |
86.4 |
16.9 |
|
ID |
Nampa |
86.2 |
28.1 |
|
SD |
Black Hawk |
85.8 |
36.3 |
|
IL |
Granite City |
83.3 |
27.2 |
|
MT |
St. Xavier |
83.1 |
29.3 |
|
IA |
Pottawattamie County |
82.9 |
30.9 |
|
HI |
Hawaiʻi County |
82.6 |
- |
|
FL |
East Naples |
82.2 |
3 |
|
MS |
Southaven |
82.2 |
18.4 |
|
TN |
Collierville |
81.3 |
17.1 |
|
WA |
Touchet |
80.2 |
21.3 |
|
AL |
Livingston |
79.9 |
9.8 |
|
KY |
Hickman |
78.3 |
18 |
|
ND |
Adams County |
78.3 |
33.5 |
|
IN |
Inglefield |
77.9 |
21.2 |
|
GA |
Harris County |
75 |
5.4 |
|
OH |
Cincinnati |
74.5 |
20.1 |
|
MN |
Luverne |
73.6 |
29.9 |
|
SC |
Aiken |
73.6 |
3.9 |
|
NC |
Indian Trail |
71.8 |
7.7 |
|
WV |
Huntington |
71.1 |
13.4 |
|
VA |
Pittsylvania County |
69.1 |
7.8 |
|
MI |
Porter Township |
64.2 |
16.7 |
|
PA |
Murrysville |
63.1 |
13.4 |
|
MD |
Montgomery County |
63.1 |
8.6 |
|
DC |
Washington |
62.8 |
7 |
|
WI |
Onalaska |
62.6 |
17.5 |
|
DE |
Susan Beach Corner |
56.5 |
0.4 |
|
NJ |
Medford Township |
52.7 |
0.1 |
|
NY |
City of Corning |
51.8 |
7 |
|
MA |
Falmouth |
44.8 |
-0.7 |
|
CT |
Greenwich |
43.3 |
-5.4 |
|
RI |
North Kingstown |
43 |
-4.1 |
|
NH |
Bedford |
41.5 |
-1.9 |
|
AK |
Ketchikan Gateway Borough |
41.4 |
- |
|
VT |
Ferrisburgh |
40.6 |
-1.3 |
|
ME |
North Berwick |
40.5 |
-2 |
Together, these early observations highlight how quickly the pattern intensified, with widespread warmth already in place before the weekend peak.
Peak Intensity: Saturday and Sunday
By the weekend, the heat dome had fully developed, and the most extreme conditions shifted eastward. Saturday stood out as the peak of this heat event for most places, with monthly records set across multiple states, particularly from the Southwest through the central U.S. In some locations, temperatures exceeded not only March records, but also historical benchmarks for April.
One notable example:
- Fort Collins, Colorado reached 91°F
- Previous March record: 80°F
- Previous April record: 89°F
In this case, the month of March in Fort Collins, CO now holds a higher record temperature than April, an indication of just how anomalous this event became.
Across parts of the Plains like South Dakota, Nebraska, and Iowa, temperature departures reached 40–50°F above normal, placing this event well outside typical early spring variability.

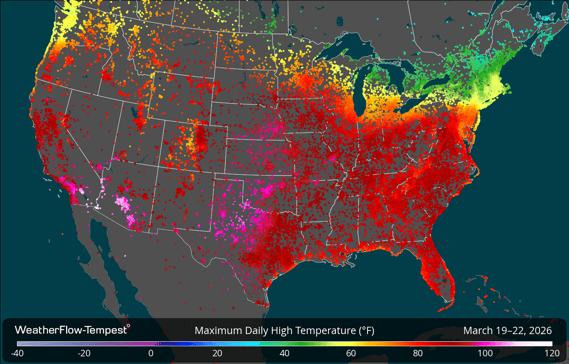
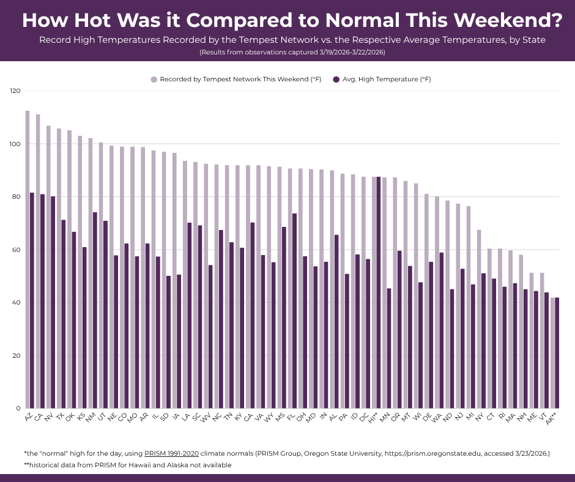
Temperatures in multiple states were higher than average by between 30-40 degrees (marked in darker purple), with the largest difference being near 47°F.
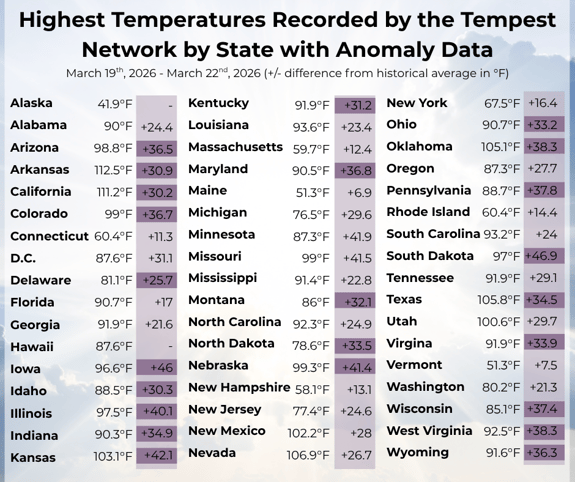
Chart comparing the record highs recorded during the weekend with the historical average normal temperature of the same day.
Top 20 Temperatures Recorded by a Tempest Station Between 3/19/2026-3/22/2026
(Tables may need to be scrolled to view full data on mobile devices)
|
State |
Nearest City |
Temperature |
Anomaly |
|
AZ |
Yuma |
112.5 |
30.9 |
|
AZ |
Hidden Shores Village |
112.1 |
30.4 |
|
AZ |
Fortuna Foothills |
111.9 |
30.3 |
|
CA |
Indio |
111.2 |
30.2 |
|
AZ |
Fortuna Foothills |
111.2 |
29.7 |
|
AZ |
Sierra Sands |
111.2 |
29.5 |
|
AZ |
Goodyear |
111 |
31 |
|
CA |
Indio |
110.8 |
29.8 |
|
CA |
Indio |
110.7 |
29.7 |
|
CA |
Imperial |
110.3 |
29.3 |
|
CA |
Lake Havasu City |
110.3 |
29.4 |
|
CA |
El Centro |
110.3 |
29.4 |
|
AZ |
Fortuna Foothills |
110.3 |
28.7 |
|
AZ |
Mohave County |
110.1 |
30.7 |
|
AZ |
Yuma |
110.1 |
28.5 |
|
AZ |
Avondale |
109.9 |
30.2 |
|
AZ |
Peoria |
109.9 |
31.7 |
|
AZ |
Yuma County |
109.9 |
28.3 |
|
AZ |
Fortuna Foothills |
109.9 |
28.3 |
|
AZ |
Yuma |
109.9 |
28.3 |
Top 25 Temperatures Anomalies Between 3/19/2026-3/22/2026
|
State |
Nearest City |
Temperature |
Anomaly |
|
SD |
Hartford |
93 |
47.8 |
|
SD |
Sioux Falls |
93 |
47.2 |
|
SD |
Sioux Falls |
92.8 |
47.2 |
|
SD |
Sioux Falls |
92.8 |
47.1 |
|
SD |
Clay County |
97 |
46.9 |
|
SD |
Sioux Falls |
93 |
46.9 |
|
SD |
Minnehaha County |
91.9 |
46.8 |
|
SD |
Sioux Falls |
92.3 |
46.6 |
|
SD |
Lincoln County |
93 |
46.5 |
|
SD |
Brandon |
91.8 |
46.2 |
|
SD |
Sioux Falls |
91.8 |
46.1 |
|
NE |
Dodge County |
98.2 |
46.1 |
|
IA |
Plymouth County |
95.7 |
46 |
|
SD |
Turner County |
94.6 |
46 |
|
SD |
Emmet Township |
93.4 |
46 |
|
SD |
Brandon |
91.6 |
46 |
|
SD |
Minnehaha County |
90.9 |
45.9 |
|
NE |
Columbus |
97.9 |
45.9 |
|
SD |
Wynstone |
96.1 |
45.8 |
|
NE |
Cuming County |
97 |
45.8 |
|
IA |
O'Brien County |
90.9 |
45.7 |
|
SD |
Brandon |
91.4 |
45.6 |
|
SD |
Sioux Falls |
91.4 |
45.6 |
|
SD |
Sioux Falls |
91.4 |
45.6 |
|
SD |
Beresford |
93 |
45.4 |
Top Temperature Recorded in Each State Between 3/19/2026-3/22/2026
*Note: For this data, the historical “average” temperature is coming from PRISM Group (PRISM Group, Oregon State University, https://prism.oregonstate.edu, accessed 3/23/2026). Data for Hawaii and Alaska not available. Observations below were recorded anytime between Thursday, March 19th 2026 and Sunday, March 22nd 2026.
|
State |
Closest City |
Temperature |
Anomaly |
|
AZ |
Yuma |
112.5 |
30.9 |
|
CA |
Indio |
111.2 |
30.2 |
|
NV |
Bullhead City |
106.9 |
26.7 |
|
TX |
Stamford |
105.8 |
34.5 |
|
OK |
Mangum |
105.1 |
38.3 |
|
KS |
Elk Falls |
103.1 |
42.1 |
|
NM |
Eddy County |
102.2 |
28 |
|
UT |
St. George |
100.6 |
29.7 |
|
NE |
Cambridge |
99.3 |
41.4 |
|
CO |
Ordway |
99 |
36.7 |
|
MO |
Festus |
99 |
41.5 |
|
AR |
Mountain Home |
98.8 |
36.5 |
|
IL |
Columbia |
97.5 |
40.1 |
|
SD |
Clay County |
97 |
46.9 |
|
IA |
Woodbury County |
96.6 |
46 |
|
LA |
Shreveport |
93.6 |
23.4 |
|
SC |
Sumter County |
93.2 |
24 |
|
WV |
Hampshire County |
92.5 |
38.3 |
|
NC |
Columbus County |
92.3 |
24.9 |
|
TN |
Cheatham County |
91.9 |
29.1 |
|
KY |
Calvert City |
91.9 |
31.2 |
|
GA |
Augusta |
91.9 |
21.6 |
|
VA |
Albemarle County |
91.9 |
33.9 |
|
WY |
Goshen County |
91.6 |
36.3 |
|
MS |
Monroe County |
91.4 |
22.8 |
|
FL |
Jacksonville |
90.7 |
17 |
|
OH |
Ironton |
90.7 |
33.2 |
|
MD |
Washington County |
90.5 |
36.8 |
|
IN |
Bloomington |
90.3 |
34.9 |
|
AL |
Decatur |
90 |
24.4 |
|
PA |
Licking Creek Township |
88.7 |
37.8 |
|
ID |
Nampa |
88.5 |
30.3 |
|
DC |
Washington |
87.6 |
31.1 |
|
HI |
Hawaiʻi County |
87.6 |
- |
|
MN |
Clinton Township |
87.3 |
41.9 |
|
OR |
Kerby |
87.3 |
27.7 |
|
MT |
Hardin |
86 |
32.1 |
|
WI |
Cassville |
85.1 |
37.4 |
|
DE |
Redden Crossroads |
81.1 |
25.7 |
|
WA |
Touchet |
80.2 |
21.3 |
|
ND |
Adams County |
78.6 |
33.5 |
|
NJ |
Mansfield Township |
77.4 |
24.6 |
|
MI |
Dundee |
76.5 |
29.6 |
|
NY |
New York |
67.5 |
16.4 |
|
CT |
Greenwich |
60.4 |
11.3 |
|
RI |
Narragansett |
60.4 |
14.4 |
|
MA |
Needham |
59.7 |
12.4 |
|
NH |
Hollis |
58.1 |
13.1 |
|
ME |
York |
51.3 |
6.9 |
|
VT |
Bennington |
51.3 |
7.5 |
|
AK |
Coffman Cove |
41.9 |
- |
A Rapid Shift: The Pattern Breaks
By Sunday evening, the pattern shifted quickly. A passing system brought rain, storms, and a sharp drop in temperatures across much of the country. In many locations, conditions transitioned from well above normal to below average in a matter of hours, bringing an abrupt end to the heat.
While short-lived, this event stood out for both its geographic reach and magnitude of anomalies.
- Early signals were visible by midweek
- Peak intensity brought record-breaking temperatures
- Some regions experienced 40–50°F departures from normal
- The pattern both built and collapsed rapidly
Events like this highlight how quickly atmospheric patterns can evolve - and how far temperatures can deviate from seasonal expectations under the right conditions.
The Value of Real Time Heat Alerts During Rapid Changes
Events like this past weekend's heat dome highlights how quickly temperatures can rise, and then shift back again. While daily highs help define the scale of an event, they don’t always indicate when conditions are becoming more impactful or when to take action.
HeatAlert, powered by the Tempest Network, is designed with that in mind - providing real-time alerts and notifications before it's too late and as conditions continue to change. By tracking factors like temperature, humidity, “feels like,” and WBGT, Heat Alert brings critical heat and weather information to your fingertips, helping you stay aware of conditions that matter most to your family or business.
During fast-moving or short-lived events like this, access to that level of information with timely awareness can make a meaningful difference.

While brief, this stretch of warmth was widely felt (the spirit of the spring of deception lives on). Across much of the country, it offered a glimpse of late spring conditions before quickly giving way to a much cooler start to the week. Those rapid swings are a hallmark of the season, but events like this show just how far temperatures can stretch from normal, even just for a short period of time.
Back to: Articles, Extreme Weather